.svg)
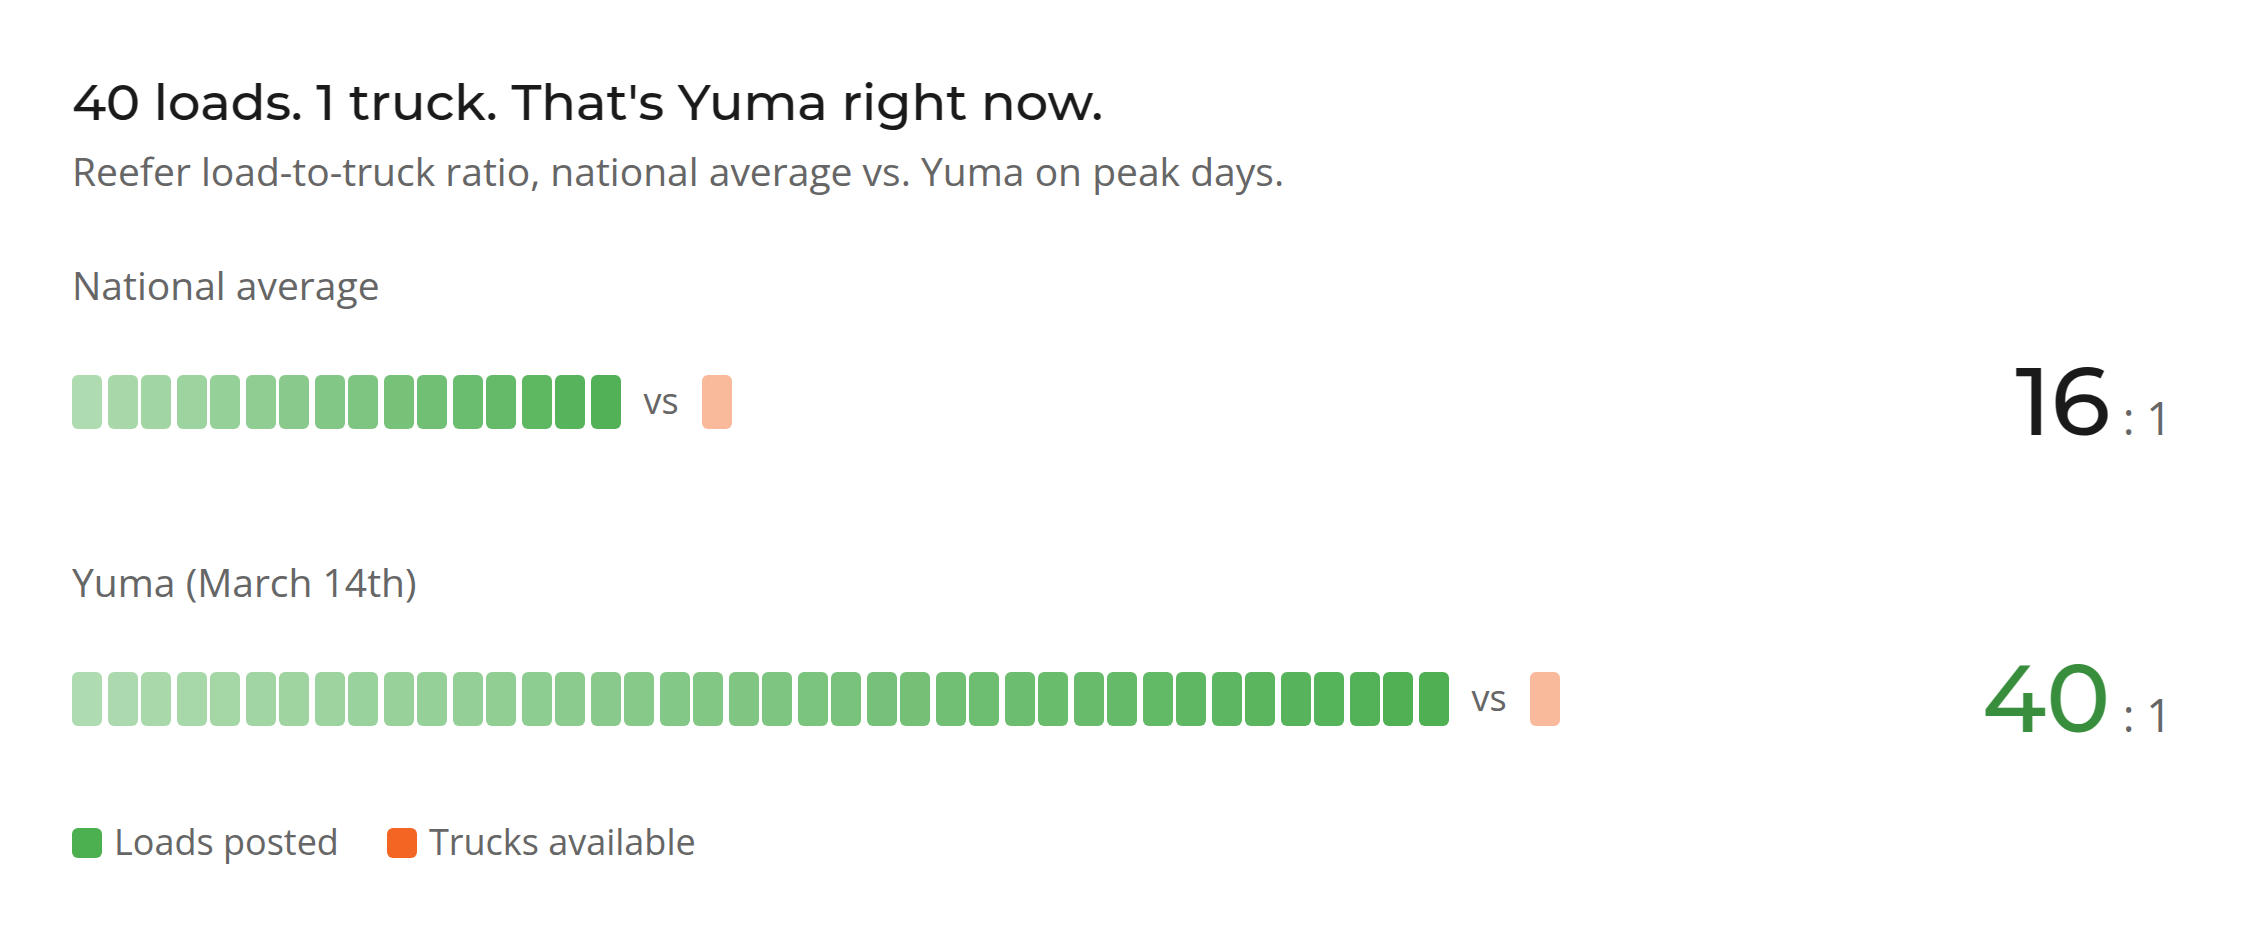
Yuma hit a 40-to-1 load-to-truck ratio on March 14th.
It is the sharpest example of what is happening across the Southwest and increasingly the rest of the country. Diesel has not moved this fast since 2022. The driver pool is permanently shrinking. Carriers are refusing entire regions. Shippers cannot tell what is real and what is opportunism. Brokers are bleeding. Budgets have not caught up to the market. And every week that gap stays open, more freight goes sideways.
Carriers are refusing entire regions.
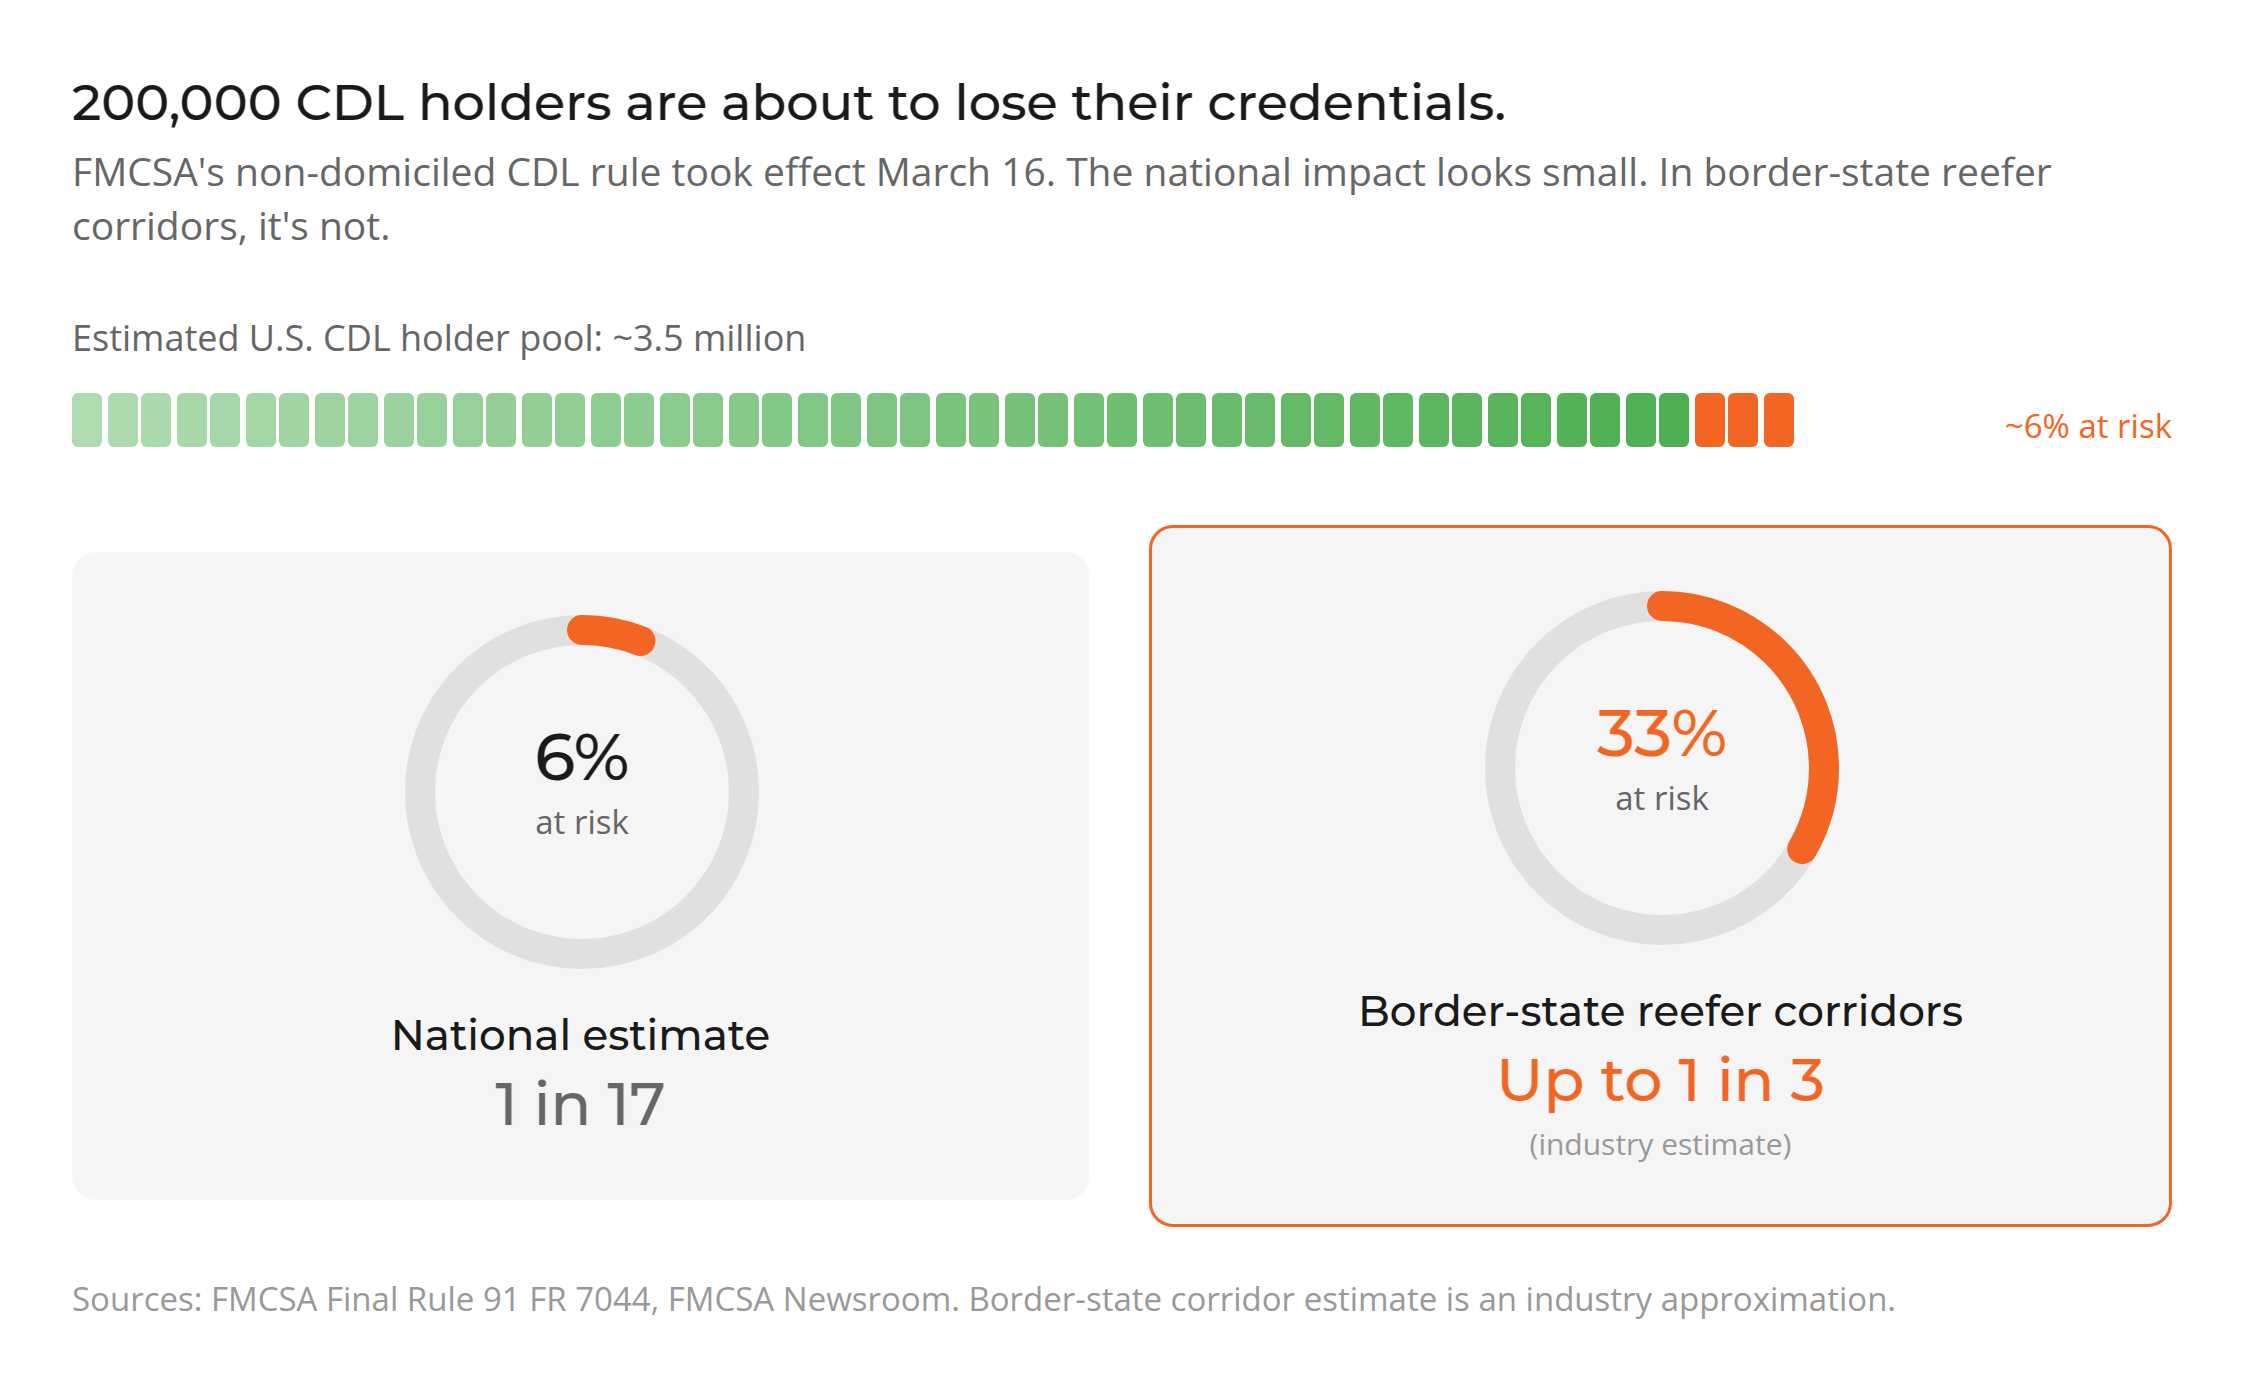
We are hearing it on the phones every day. Carriers who have run border-state lanes for years will not go near Arizona, South Texas, or Florida right now. ICE enforcement at weigh stations, English language proficiency checks, and the FMCSA’s non-domiciled CDL final rule have changed the calculus. That rule, effective March 16, limits CDL eligibility to specific employment-based visa holders. FMCSA estimates approximately 200,000 non-domiciled CDL holders and 20,000 CLP holders will be affected as credentials come up for renewal [1]. Over 10,000 drivers have been placed out of service for ELP violations since June 2025, and more than 40% of CDL training providers are under federal review [2]. When capacity leaves a region out of fear, not economics, supply does not gradually tighten. It disappears.
South Texas and Nogales are right behind.
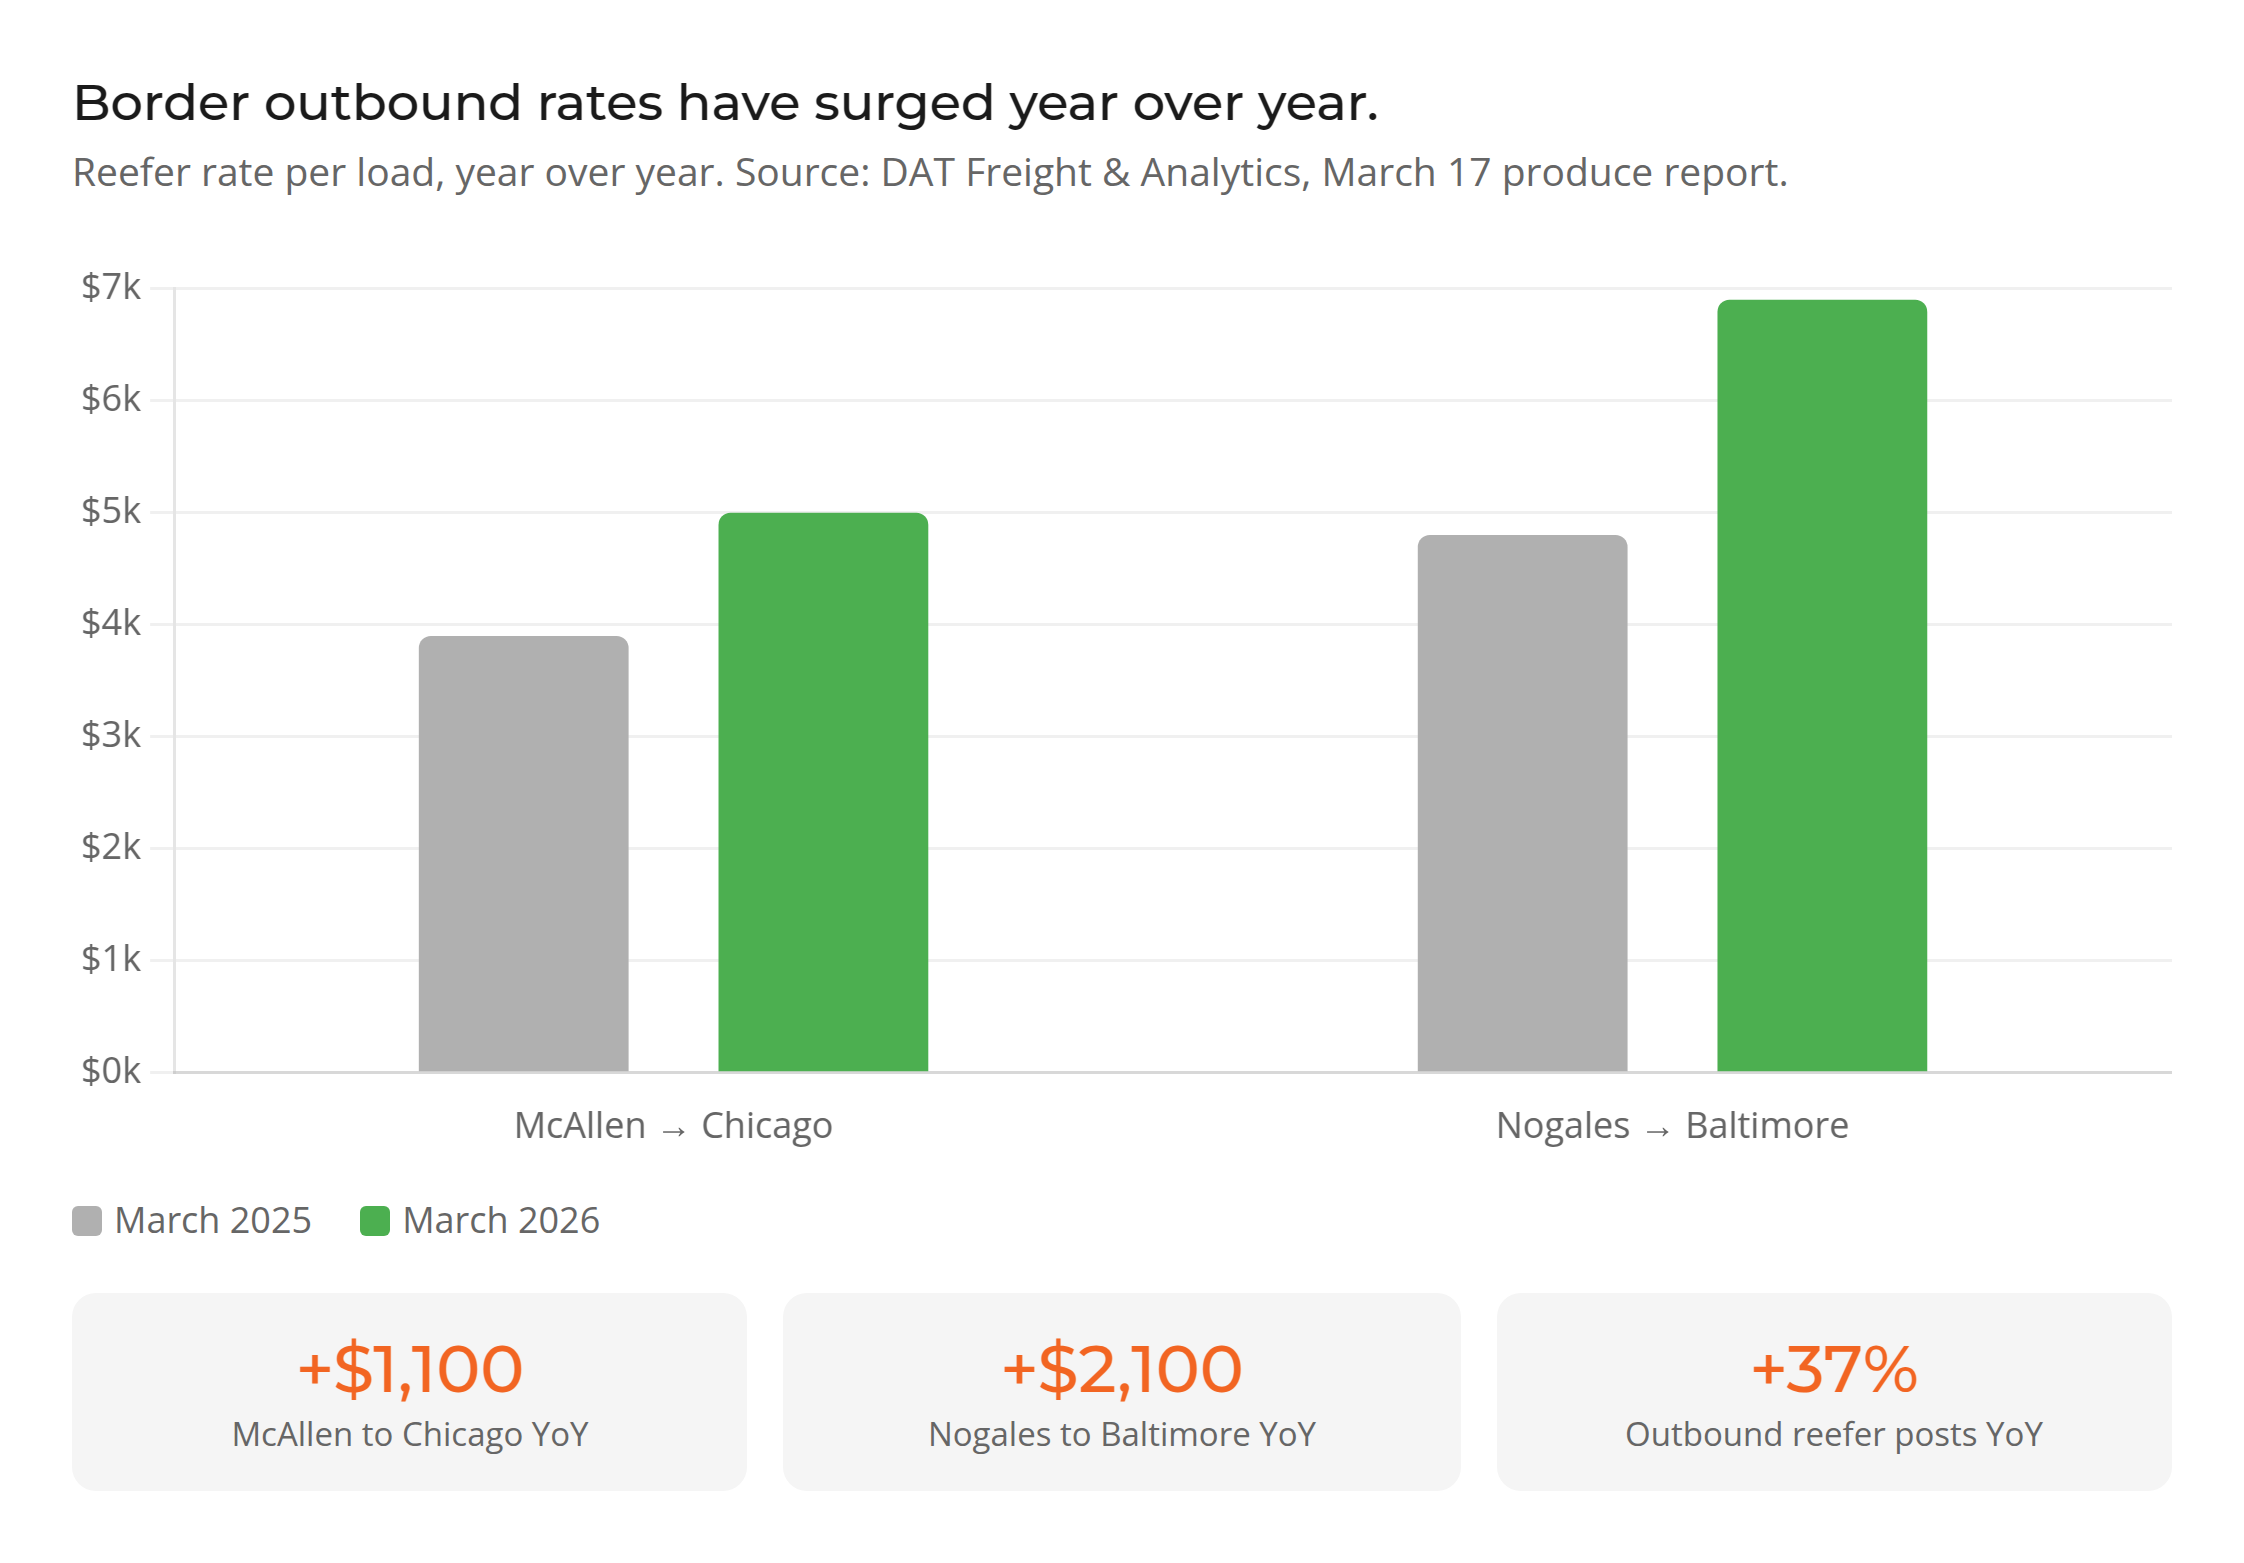
Nationally, spot van and reefer rates have climbed for seven consecutive months. Reefer capacity is 120% tighter than this time last year. Total broker-posted spot rates reached their highest level since the end of 2022 [3]. Yuma is the extreme case, but it is not an outlier. DAT’s March 17 produce report shows South Texas as the tightest produce origin in the country. McAllen to Chicago is commanding $1,100 more per load than a year ago. Outbound reefer posts up 37% year over year. Nogales to Baltimore is paying carriers $2,100 more per load than last year, with load posts up 69% [4]. That said, not every region looks like the Southwest. The Midwest and parts of the Southeast still have workable capacity and rates that make sense. The opportunities are there if you know where to look.
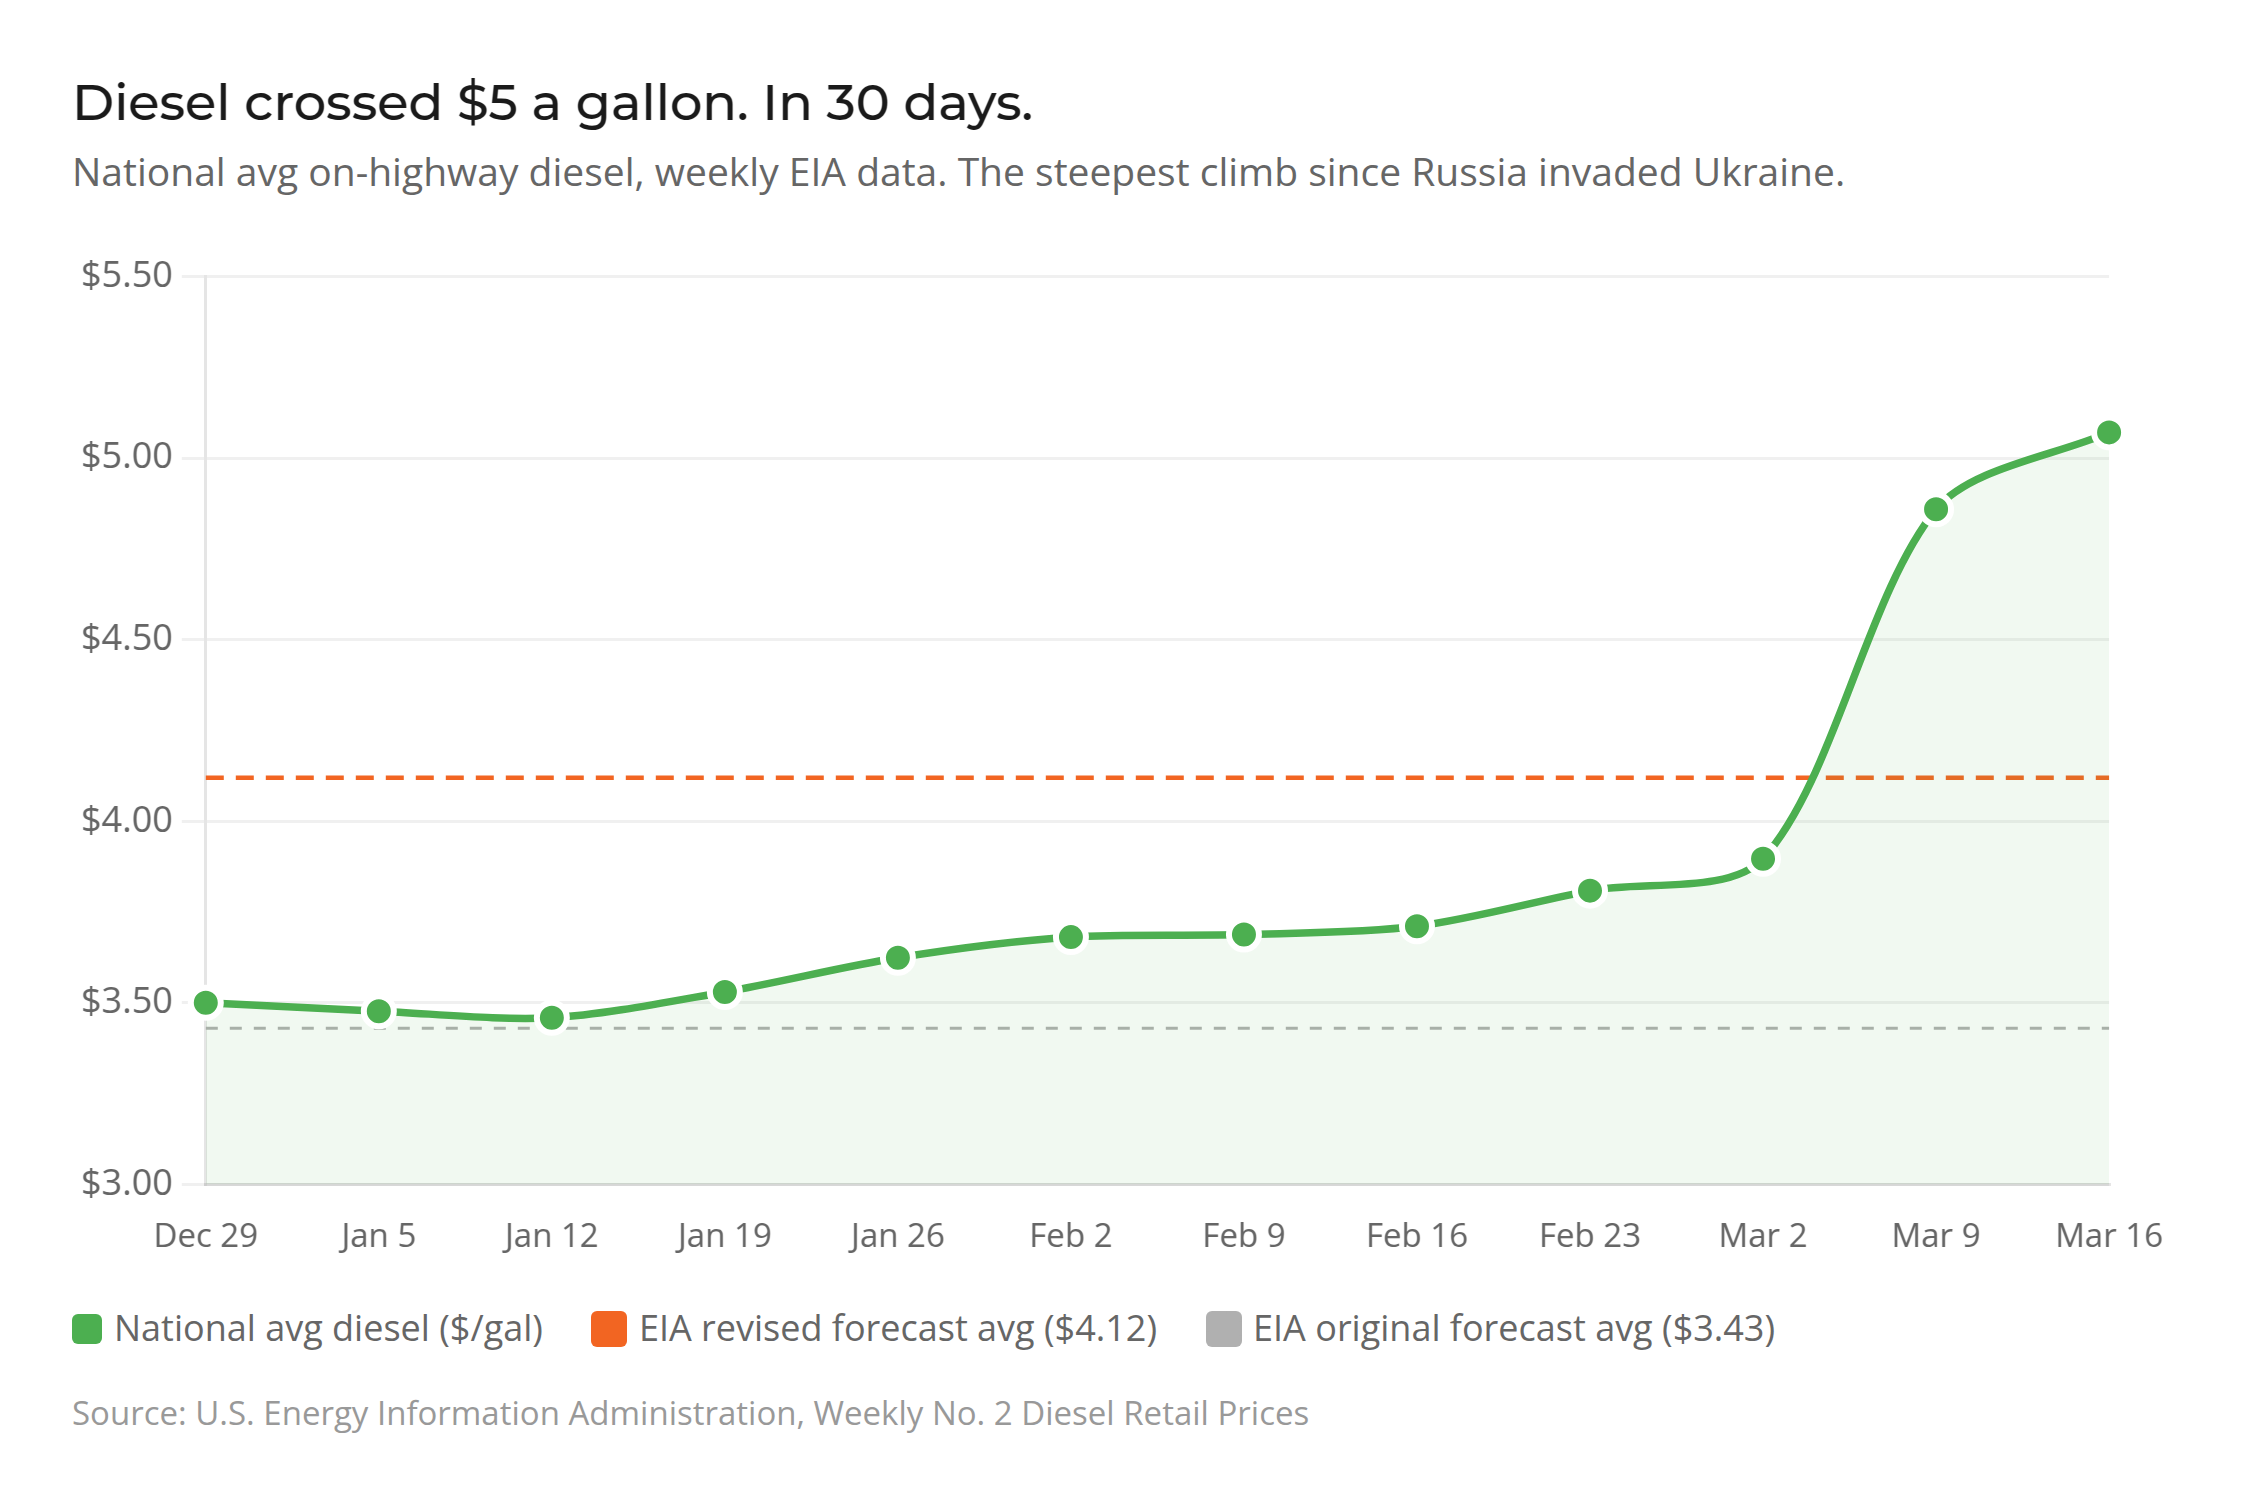
Diesel crossed $5 a gallon. In 30 days.
Fuel is roughly 21% of a carrier’s total cost per mile. When it moves this fast, surcharges lag behind reality. Carriers eat the difference or refuse the load. The national average for on-highway diesel hit $5.09 per gallon on March 19, according to AAA. One month ago it was $3.69 [5]. That is a 38% increase in 30 days, the steepest climb since Russia invaded Ukraine. In California it is $6.50. The EIA’s latest weekly report shows price increases in all five U.S. regions, with diesel now $1.27 higher year over year nationally [6]. The cause is the Iran conflict and the near-total halt of tanker traffic through the Strait of Hormuz. The EIA revised its full-year 2026 diesel forecast from $3.43 to $4.12 per gallon in its March Short-Term Energy Outlook [7].
There is blood in the water... And the sharks showed up.
When there is blood in the water, carriers smell it. That is how spot markets work. Some of the rates being quoted right now are opportunistic, not reflective of actual operating costs. Every headline about $5 diesel, ICE raids, and CDL revocations gives leverage to anyone quoting a load. Some of that leverage is earned. Some of it is market gaming. But strip out the noise and the fundamentals are still broken. Diesel is up 38% in a month. The driver pool is structurally shrinking. ACT Research revised its full-year reefer rate forecast upward, citing capacity contraction and regulatory-driven supply constraints as a firmer structural backdrop than previously assumed [8]. The floor has moved even if the ceiling is being pushed artificially higher.
Where we sit.
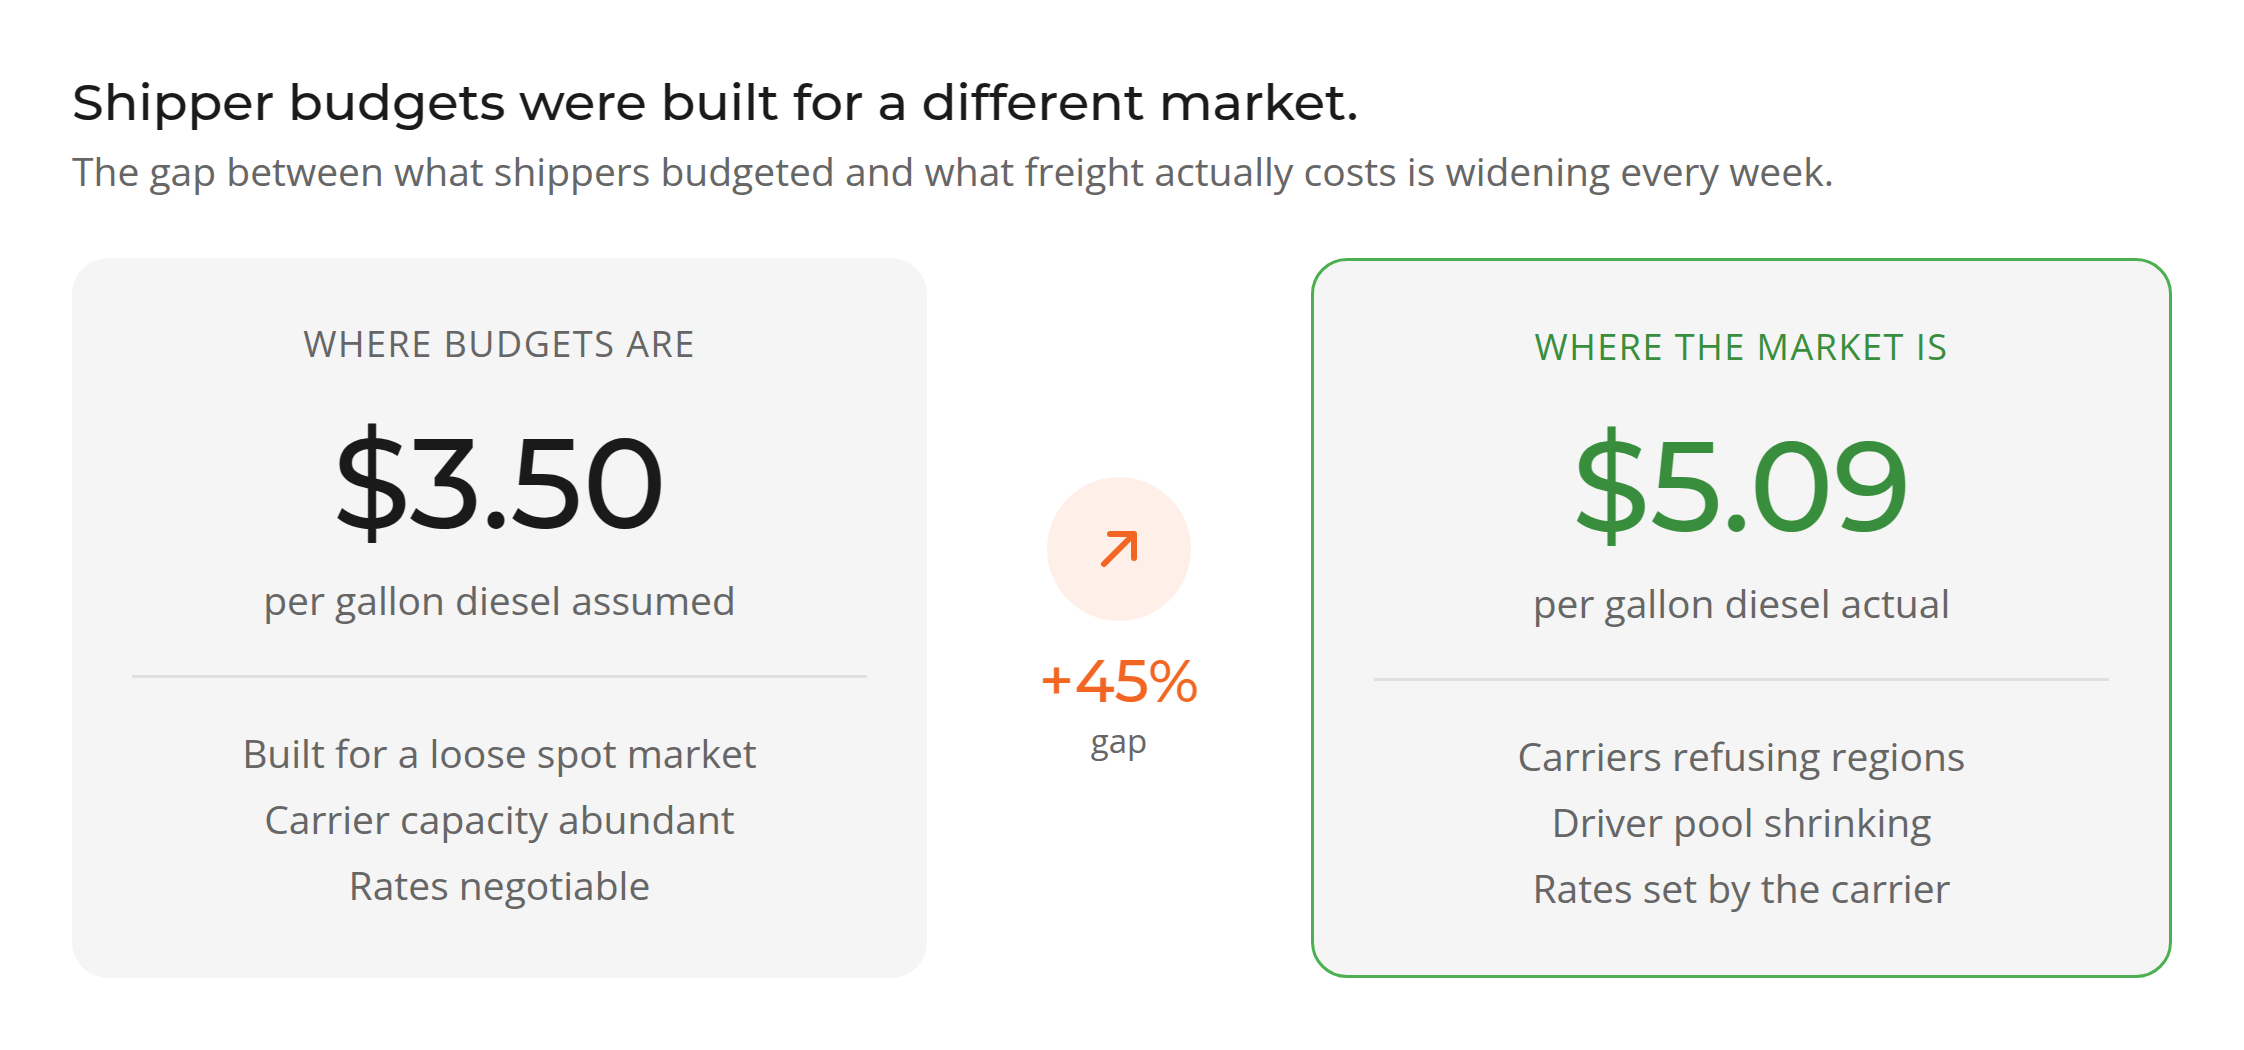
We will be direct. At current shipper budgets, it is difficult to be profitable while maintaining the service quality we hold ourselves to. And we know we are not alone. We work these markets every day, talking to carriers, watching capacity shift in real time. More brokers are eating costs right now than they would care to admit. The gap between what shippers are budgeted to pay and what it actually costs to put a compliant driver on a truck is widening every week.
This is not a margin conversation. It is a pass-through cost conversation. Fuel. Driver wages. Insurance. Equipment. Compliance. Fraud prevention. Budgets built for $3.50 diesel and a loose spot market do not work in 2026. If they do not adjust, freight stalls. Orders go unfilled. And the impact does not stay inside a spreadsheet. It shows up on the shelf at the grocery store.
At Fresh Freight, we cover Yuma, Nogales, McAllen, and the toughest Southwest corridors every day with an owned fleet and thousands of vetted carrier partners across Arizona, California, and Texas. We were built for temperature-controlled produce and perishables, and these are the conditions where that specialization matters most. If you want a straight answer on what your lanes actually cost today, we will give you one.
Sources
[1] Federal Motor Carrier Safety Administration. (2026, February 13). Restoring integrity to the issuance of non-domiciled commercial driver’s licenses. 91 FR 7044.
https://www.federalregister.gov/documents/2026/02/13/2026-02965/restoring-integrity-to-the-issuance-of-non-domiciled-commercial-drivers-licenses-cdl
[2] Federal Motor Carrier Safety Administration. (2026, February 13). Final rule announcement: Stopping unqualified foreign drivers.
https://www.fmcsa.dot.gov/newsroom/trumps-transportation-secretary-sean-p-duffy-puts-safety-first-finalizes-rule-stop
[3] DAT Freight & Analytics. (2026, March 17). Truckload spot rates post seventh straight monthly gain [Press release].
https://www.dat.com/company/news-events/news-releases/dat-truckload-spot-rates-post-seventh-straight-monthly-gain
[4] DAT Freight & Analytics. (2026, March 17). Reefer produce report: The calm lasted one week.
https://www.dat.com/blog/reefer-produce-report-the-calm-lasted-one-week-nogales-south-texas-and-florida-all-tighten
[5] AAA. (2026, March 18). AAA gas prices.
https://gasprices.aaa.com/
[6] U.S. Energy Information Administration. (2026, March 17). Gasoline and diesel fuel update.
https://www.eia.gov/petroleum/gasdiesel/
[7] U.S. Energy Information Administration. (2026, March 10). Short-term energy outlook.
https://www.eia.gov/outlooks/steo/
[8] ACT Research. (2026, February). Truck freight rates: February 2026 update and trends.
https://www.actresearch.net/resources/data-tracking/freight-trucking-rates