.svg)
Executive Summary
Expect trucks to become harder to find and more expensive as the year ends. Spot reefer rates are already 40% above last year, and EIA projects diesel prices to peak in Q4 within its forecast. The national reefer load-to-truck ratio rose roughly 50% from November to December in each of the past two years. A similar increase this year would bring it near 30-1, or about 30 posted loads for every posted truck. Yuma and the Pacific Northwest face the greatest pressure as lettuce production shifts to the desert earlier and storage crops ship through the holidays.
There will still be opportunities to secure favorable rates. Freight leaving Florida and entering the Pacific Northwest should be easier to cover, while California should remain balanced through most of the quarter. For the busiest regions, secure reliable carriers before seasonal demand builds. Early commitments can reduce the risk of missed pickups and expensive last-minute replacements.
Our Method
Click to Answer
- Which commodities move when, and out of which origins?
- Five regions to watch and what is driving each one?
- Which seasonal programs pull trucks out in November and December?
- Where the holiday calendar takes capacity out of the market?
- Where does the macro market stand — rates, fuel, drivers and weather?
- Where our network can support your lanes?
Q4 Produce Volume and Reefer Capacity Overview: Interactive Charts
Regardless of the type of perishables you are shipping, produce movements drive reefer capacity and pricing within key regions. Analyzing these patterns provides a strong general indicator of market conditions. Use the interactive charts to explore how your region or commodity is affected.
5 Regional Shifts to Watch — Q4 2026
Texas & Arizona / Mexico Cross-Border | Avocados, Limes, Cucumbers & Tomatoes
What drives the volume: Mexico is by far the largest Q4 origin, moving 2.68 million tons in Q4 2025, 36% of reported produce truck volume and more than twice California's 1.11 million. South Texas handled 1.66 million tons through Pharr and the Lower Rio Grande Valley, while Nogales added 534k. Avocados led at 352k tons, up 9% year over year, followed by limes at 181k and plum tomatoes at 137k. Nogales runs a different mix, led by cucumbers at 128k and watermelons at 103k. Unlike domestic harvests, import volume builds through December.
Areas/lanes hit hardest: Border capacity tightened sharply in Q4 2025 and is likely to remain pressured this year. South Texas reported a truck surplus in 2023 and a slight surplus in 2024, but that cushion disappeared last year: a slight surplus in October, adequate in November, and a slight shortage in December, just as crossings peaked. Nogales followed the same pattern into year-end. Rates confirm it. Texas border rates for hauls of 501 to 1,500 miles averaged $2.81 per mile, up 9% year over year, even as Mexican volume fell 2%. Rates rising on falling volume is a capacity signal, not a demand one. Heightened border and driver enforcement likely contributed, and continued enforcement in 2026 could keep capacity tight again this Q4.
California | Grapes, Citrus & the Winter Handoff
What drives the volume: California enters Q4 with a mixed but generally stable outlook. Among the state's major reported commodities last year, grapes held nearly flat, while celery declined 15%, strawberries 30%, iceberg lettuce 24% and romaine 26%. Grapes and strawberries should support a modest recovery this year, while lettuce and celery are likely to remain flat or soft. Citrus will add volume as oranges, mandarins and clementines build through November and December.
Areas/lanes hit hardest: California should remain a balanced freight market through most of Q4, with some tightening possible in December. Softer volume does not necessarily produce lower rates because carriers tend to leave the state as freight thins. Watch southern San Joaquin Valley lanes around Fresno, Tulare and Kern as winter citrus ramps, along with the Salinas-to-Yuma transition for leafy greens. Heat or autumn storms could shift harvest schedules and create short periods of tighter capacity.
Pacific Northwest | Potatoes, Apples, Onions & Pears
What drives the volume: PNW volume builds throughout Q4 and has grown from 1.40 million tons in 2022 to 1.75 million in 2025—the equivalent of roughly 80,000 truckloads of produce. Potatoes and apples lead at roughly 565k tons each, followed by onions at 471k and pears at 147k. USApple forecasts Washington's crop at 176 million bushels, down just 2%. Regional potato acreage is down 3%, led by a 5% reduction in Idaho—too little to materially ease Q4 freight demand.
Areas/lanes hit hardest: Outbound capacity should tighten sharply from Thanksgiving through year-end as apple, potato and onion demand converges across Yakima, Wenatchee, the Columbia Basin and southern Idaho. Early apple-season conditions are already showing the imbalance. Rates on the tightest lanes could reach record levels and exceed the projected 40% nationwide year-over-year increase. Inbound freight should be much easier and less expensive to cover as carriers reposition into the region.

Florida | Tomatoes, Strawberries & Winter Vegetables
What drives the volume: Florida's Q4 crop looks normal to slightly stronger, with volume building later in the quarter. Tomatoes, sweet corn, cucumbers and squash begin shipping in October, followed by peppers and snap beans in November and strawberries in December. Growing capacity appears stable, and the most recent published strawberry acreage estimate was up 4.5%. Absent a major storm, total volume should remain near historical Q4 levels.
Areas/lanes hit hardest: Florida's freight imbalance creates two distinct markets. More trucks enter the state than can find outbound reloads this time of year, making inbound capacity expensive and outbound capacity plentiful. NOAA expects a below-normal hurricane season, reducing, but not eliminating, the risk of a major disruption. A wetter El Nino pattern presents a different concern later in the quarter, with rain potentially causing harvest delays and quality issues for tomatoes and strawberries.

Arizona & the Desert | Yuma Lettuce and an Earlier Winter Handoff
What drives the volume: Expect Arizona volume to build earlier than usual as lettuce production shifts from Salinas to Yuma. Industry expectations point to an early-November transition rather than the typical mid-to-late-November handoff. Q4 2025 shipments reached 394k tons, recovering from a soft Q4 2024 and returning to 2022-2023 levels. Romaine led the rebound, increasing 22% year over year, with iceberg, cauliflower, broccoli, cabbage and spinach adding volume. Q4 is only the opening phase: Arizona's Q1 volume typically runs about three times higher, so an earlier transition could pull freight demand forward and extend the winter shipping season.
Areas/lanes hit hardest: Yuma capacity could tighten earlier in November as the accelerated handoff overlaps with holiday freight. The desert experienced severe shortages during January and February 2026, and the driver pool has not materially recovered. Nogales faces additional pressure as winter imports from Mexico increase against a limited pool of carriers willing to handle border freight. NOAA also favors a wetter winter, raising the risk of harvest delays, detention and compressed pickup windows.
'Tis the Season
Three seasonal programs will add to Q4 freight demand beyond produce. Each will compete for trucks when capacity is already stretched.
Turkey. Six states produce 68% of the nation's turkeys: Minnesota, North Carolina, Arkansas, Indiana, Missouri and Virginia. Retail shipments will leave cold storage through October and early November, with most freight moving before Thanksgiving week. North Carolina will face overlapping demand as turkey shipments run into Christmas tree season.
Christmas trees. Oregon and North Carolina grow 58% of the country's cut Christmas trees, with shipping concentrated in a four-week window beginning in early November. Tree loads pay well and book early, competing with PNW storage crops and Southeast produce. Even shippers who never move a tree will feel the pressure on rates and availability.

Ski country. Resort openings will increase foodservice deliveries into Colorado, Utah, northern Arizona, New Mexico and California's mountain communities from Thanksgiving onward. With few outbound loads available, carriers will often charge enough to cover the return trip or decline the load. Coverage was difficult last season, and winter weather could further complicate mountain deliveries. A wetter outlook could support snowfall, but opening dates will depend on temperatures and storm timing.
Holiday Demand Pulses: Thanksgiving through New Year's
Christmas and New Year's both land on Fridays this year, gutting the back half of two consecutive weeks and stacking two three-day weekends. Each of the windows below pulls capacity out of the market, not just freight into it.
- Week of Diwali, November 8. California loses a meaningful share of its carrier base for the week — the state's reefer capacity leans heavily on Indian-owned carriers.
- Thanksgiving week through Black Friday. Drivers start repositioning toward home the Tuesday before, and long-haul coverage out of western origins is the first thing to disappear. Black Friday restocking then competes for whatever is left, and the drivers who went home aren't back until Monday.
- December 14–22. Carriers stop accepting loads that can't deliver before the 24th. Anything not picked up by the 22nd sits until the 28th.
- December 28 – January 8. The fewest trucks on the road all year, thinner out of the PNW and Chicago through Orthodox Christmas on January 7.

Macro Overview
Diesel Fuel Update
High diesel prices will keep freight costs elevated in Q4. EIA forecasts $5.55 per gallon nationally, 50% above Q4 2025. Reefer carriers must fuel both the truck and the refrigeration unit, and surcharges may not cover the full increase. California's especially high fuel costs could push smaller carriers out of the market, driving freight rates sharply higher as both operating costs and competition for available trucks rise.
Relief depends on supply. EIA's forecast assumes tanker traffic through the Strait of Hormuz returns to normal. Continued disruptions into 2027 could keep prices above forecast. Budget for elevated fuel costs and treat any relief as upside.
National Reefer Spot vs. Contract Rate
Spot is running just under contract right now, $3.43 against $3.61, after the market relaxed over the past several weeks. That gap is unlikely to hold. Spot has climbed 41% in the past year against contract's 30%, and it pushed above contract from May through July when summer produce demand peaked. Holiday demand compresses freight into fewer shipping days the same way, and spot is always the side of the market that moves first. Expect it to close the gap and likely pass contract again heading into December.
National Reefer Load-to-Truck Ratio
The reefer load-to-truck ratio has held near 20 throughout the summer, roughly double its year-ago level. In each of the past two years, the ratio moved sideways from August through November before jumping about 50% in December: from 5.82 to 8.76 in 2024 and from 10.88 to 16.72 in 2025. If that pattern repeats, a year-end ratio in the high 20s, potentially reaching 30, is a plausible outcome.
Q4 NOAA Weather Forecast
Above-normal temperatures are favored across much of the country through November, with the strongest signal in the Pacific Northwest and northern Rockies. California, the Southwest and much of the South also lean warmer. Wetter conditions are favored across the Southwest and parts of the Southeast, while portions of the Pacific Northwest, Great Lakes and Northeast lean drier. El Niño is already established and expected to strengthen into winter.
For freight, that combination means continued warmth across western growing regions and rain delays as desert production ramps up. Weather that shifts harvest timing compresses pickups into shorter windows and drives up detention, so secure reefer coverage before the seasonal handoffs and build flexibility into loading schedules. The maps cover September through November rather than the full fourth quarter.
ACT Driver Availability Index
Driver availability improved for a third straight month, rising to 38.5 in July from 34.4 in June. However, current index numbers still point to a challenging driver recruitment market. The index collapsed early this year when FMCSA purged non-domiciled CDLs and has been climbing back since. New CDL and ELD rules and the Supreme Court broker liability decision are what tightened the market in the first place, and ACT expects enforcement to keep removing drivers about as fast as new ones enter.

ACT Class 8 Net Orders
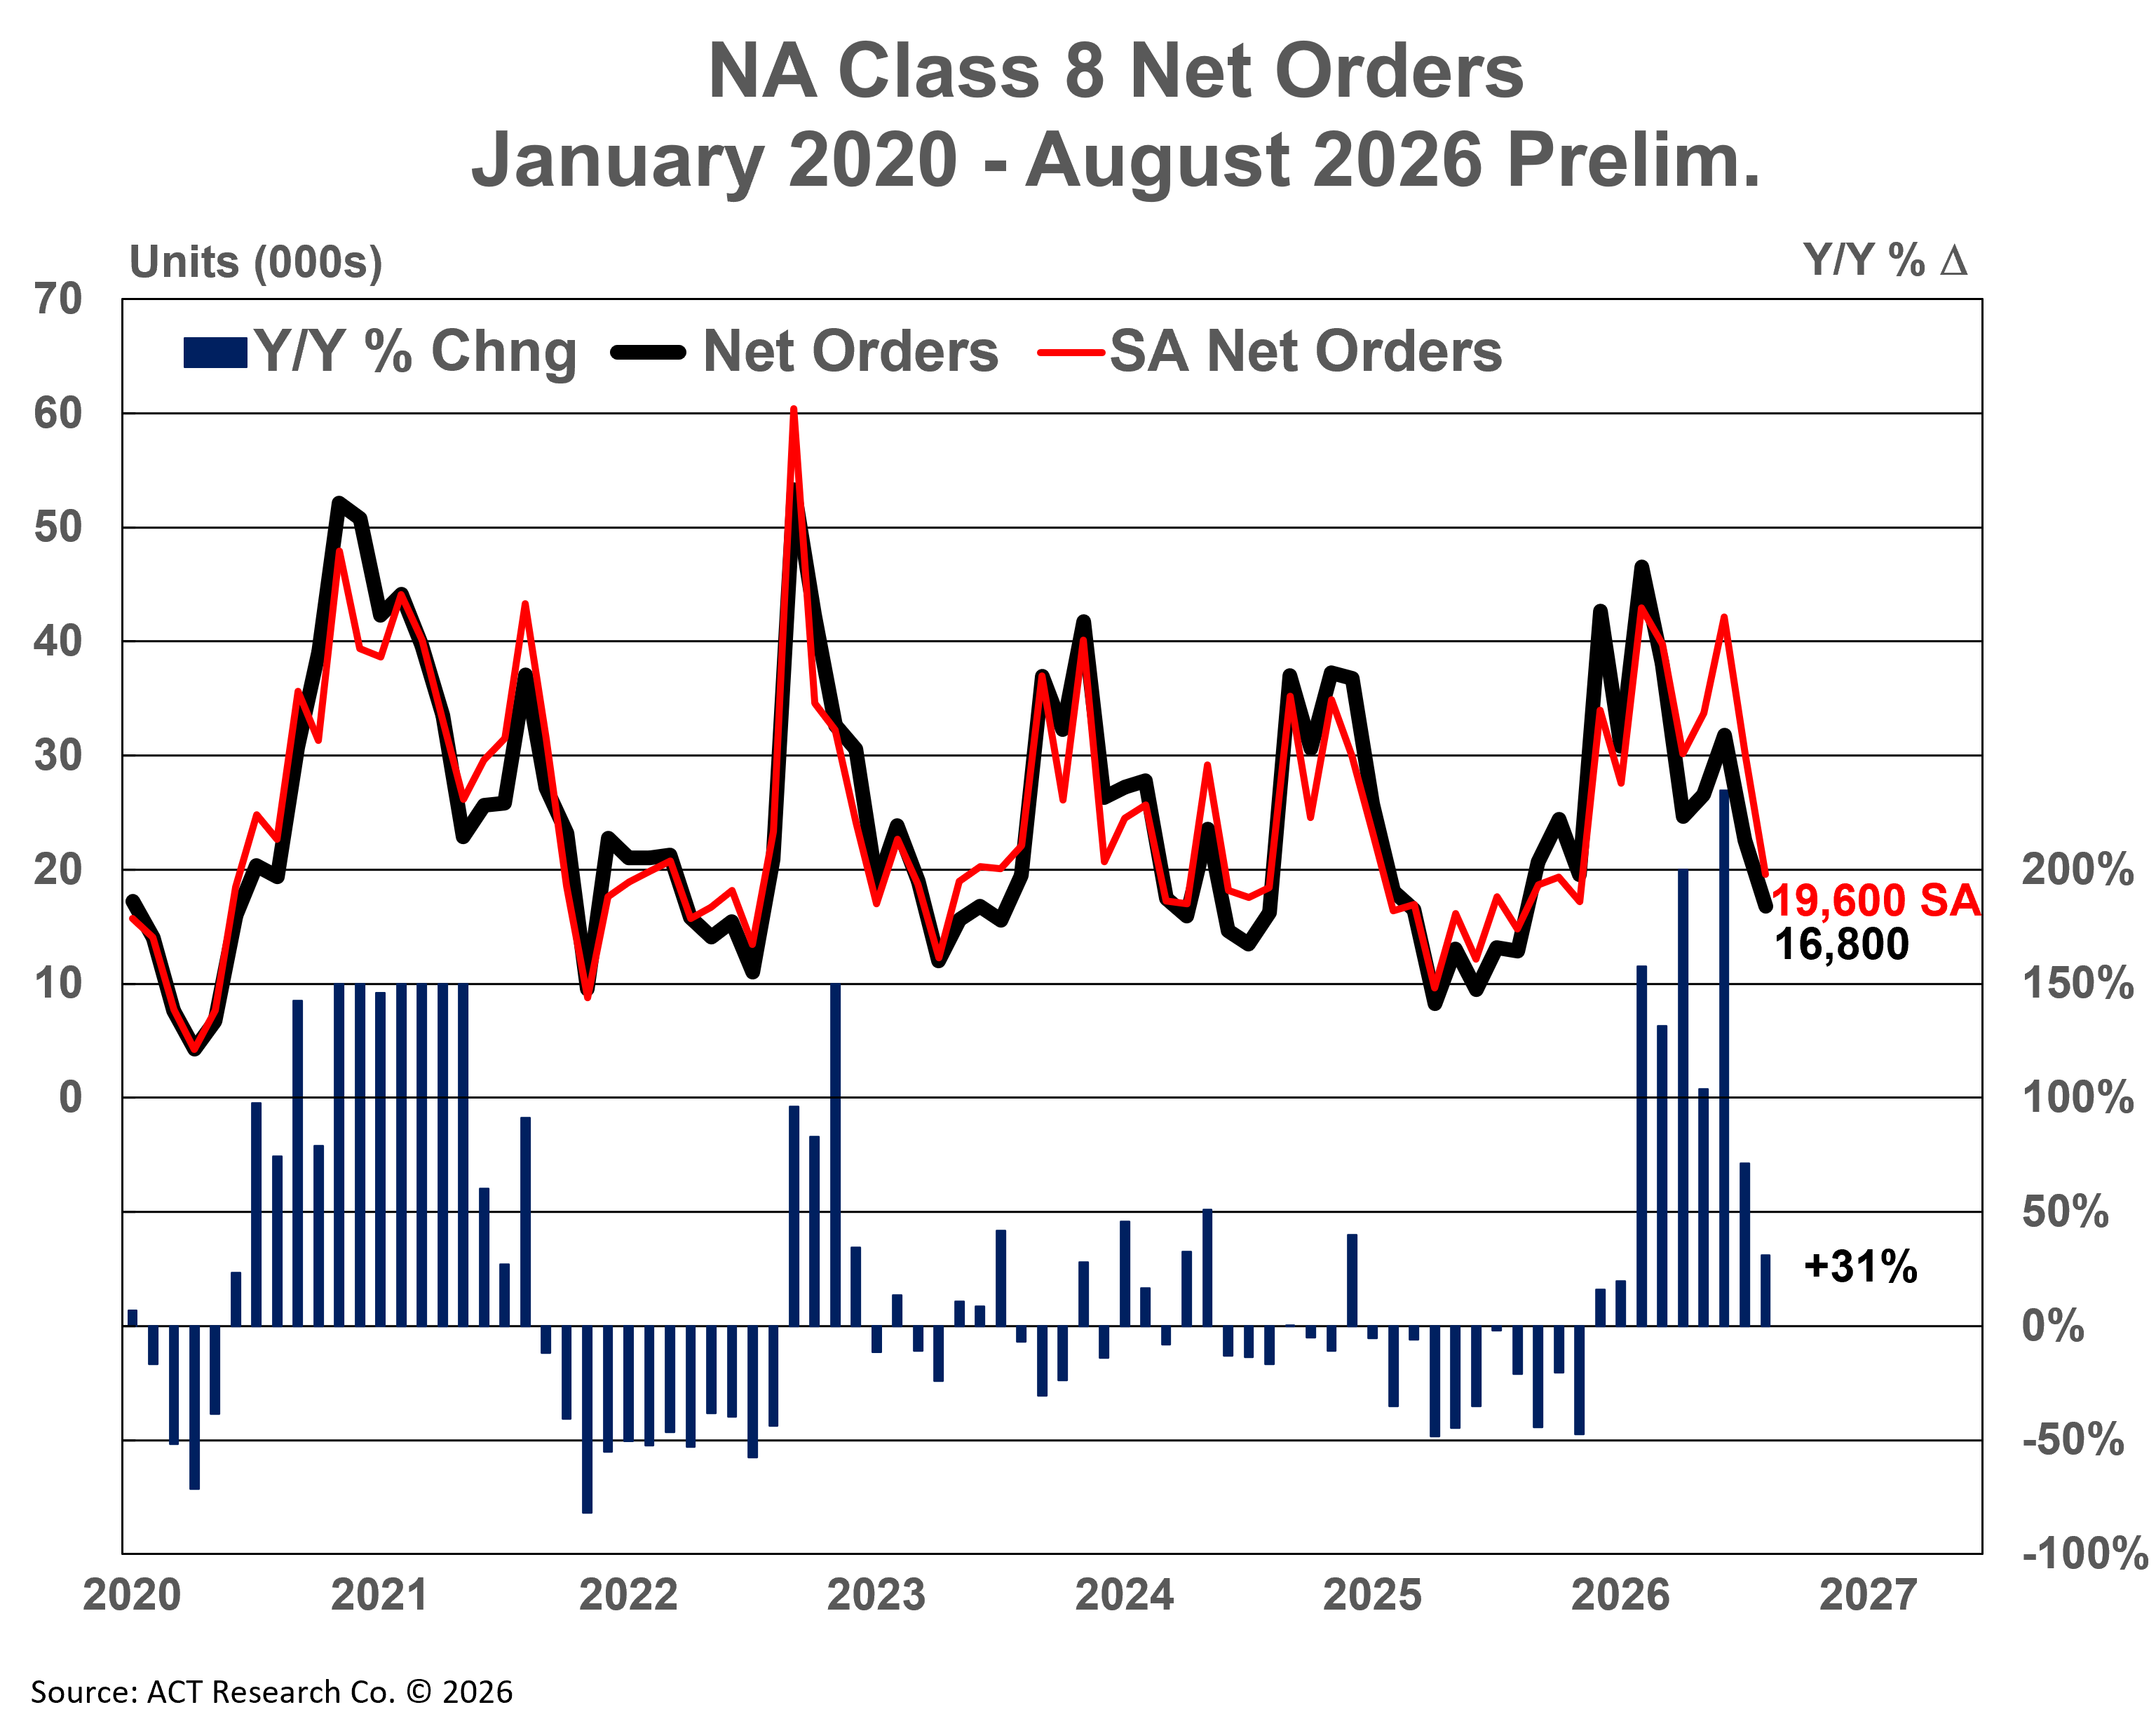
Truck makers booked 16,800 new Class 8 orders in August, up 31% from a year ago. Orders were down month over month, but 2026 build slots are already oversubscribed by about 35,000 trucks. August is also a slow ordering month, since OEMs open next year's order boards in September. Orders placed now are 2027 deliveries.
LMI Signal: Freight Prices Stay High as Capacity Keeps Shrinking
The August LMI was 66.6, down from 68.8 in July and 71.1 in June. The market has cooled slightly since early summer, but the index remains well above its historical average of 61.7. This could be a temporary seasonal slowdown, with December providing the more important test.
- Transportation prices: 90.0 — still near record highs.
- Transportation capacity: 40.0 — available capacity has declined for nine straight months, although the contraction was less severe than in July.
- Transportation utilization: 70.6 — demand for available equipment reached its second-highest level in two years.
Respondents expect the same basic conditions over the next 12 months: high prices and continued pressure on capacity.
Lane Collaboration Opportunities
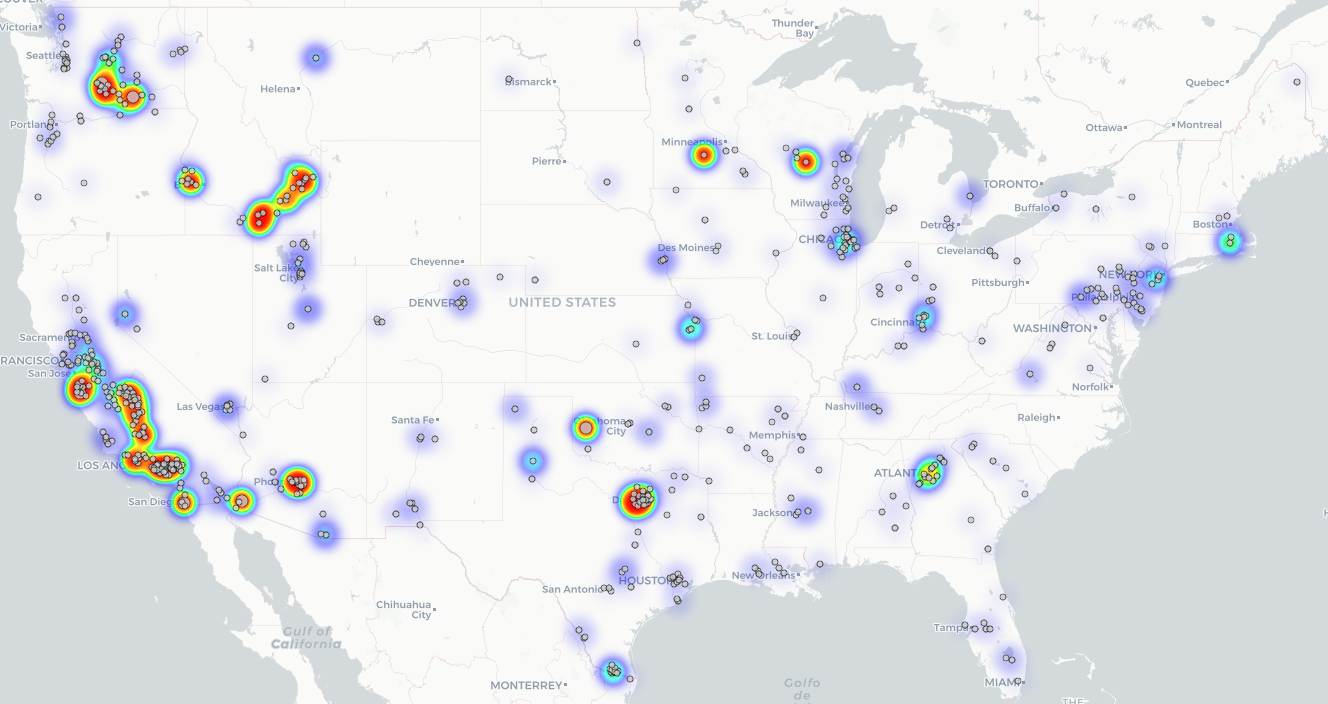
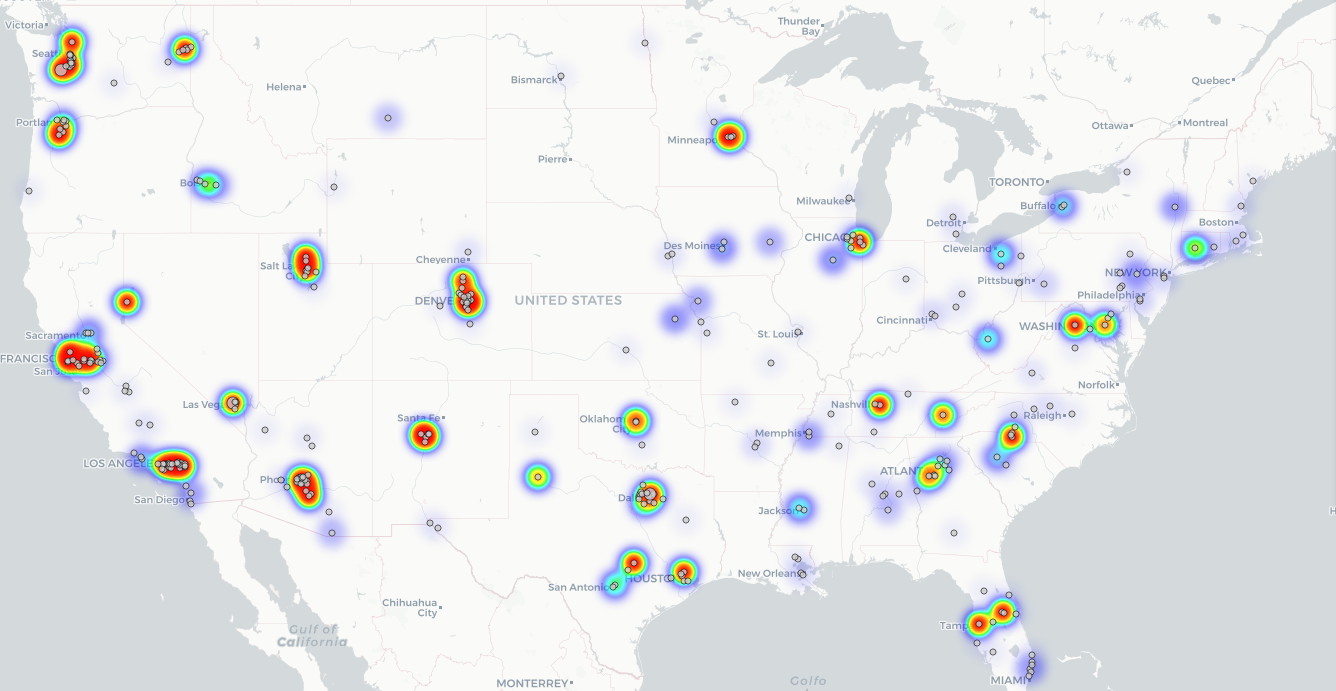
- Our origin footprint is especially dense across key produce regions: California (Salinas, Central Valley, desert), Arizona, the Pacific Northwest, and Texas, giving shippers strong coverage out of the fields and allowing us to service those lanes with ease through an established carrier network.
- If you are shipping outbound from Colorado, Atlanta and the broader Southeast, Florida, South Carolina, Washington / Northern Virginia, or Philadelphia, our network alignment in these markets creates cost-efficient outbound opportunities and reliable backhaul capacity to growing regions.
To plug your lanes into our network or request a quote, reach out to sales@freshfreight.com.
Fresh Freight Origin Heat Map
Fresh Freight Destination Heat Map
Sources
- USDA AMS — https://www.ams.usda.gov/
- USDA NASS — https://www.nass.usda.gov/ (Turkeys Raised; 2022 Census of Agriculture — https://www.nass.usda.gov/AgCensus/)
- DAT Reefer Demand & Capacity — https://www.dat.com/trendlines/reefer/demand-and-capacity
- DAT Reefer National Rates — https://www.dat.com/trendlines/reefer/national-rates
- EIA Short-Term Energy Outlook — https://www.eia.gov/outlooks/steo/
- Logistics Managers' Index (August 2026) — https://www.the-lmi.com/august-2026-logistics-managers-index.html
- ACT Research — North America Class 8 — https://www.actresearch.net/resources/blog/north-america-class-8-blog
- ACT For-Hire Trucking Index — https://pages.actresearch.net/for-hire-trucking-index
- USApple — https://usapple.org/
- NOAA CPC Seasonal Outlook — https://www.cpc.ncep.noaa.gov/products/predictions/long_range/seasonal.php